Scratching the Surface
In the standard works of The Church of Jesus Christ of Latter-day Saints, thousands of cross-references have been manually annotated by volunteers in fulfillment of prophecy:
The stick or record of Judah—the Old Testament and the New Testament—and the stick or record of Ephraim—the Book of Mormon, which is another testament of Jesus Christ—are now woven together in such a way that as you pore over one you are drawn to the other; as you learn from one you are enlightened by the other. They are indeed one in our hands. Ezekiel’s prophecy now stands fulfilled. (Boyd K. Packer, “Scriptures”, October 1982 General Conference.)
Elder Packer also discussed the immense technical challenges in 1977 when discussions with publishers began:
The technical problems seemed insurmountable. Computers could help, but there was always the human factor. How could you cross-reference the Bible with any other book? To cross-reference it with the three volumes was to require tens of thousands of footnotes. Thereafter there would be hundreds of thousands of possible combinations of information. It was too big even to think about. The technical challenge alone was staggering, to say nothing of maintaining accuracy, harmony, and consistency with the biblical text itself. It could not be done!
This blog is about tackling these combinatorial explosions with modern data science tools. What can we learn from the patterns in these inspired annotations? Are there indirect or implicit relationships that reveal new insights? Can we leverage existing connections to suggest additional annotations that “[maintain] accuracy, harmony, and consistency with the biblical text”?
This inaugural post explores some high-level questions about the rich data contained in these cross-references:
- Which verses are referenced most often?
- Are there patterns in the references within and between books?
- What does the reference network look like?
Terminology
Much of the analysis here is based on the concept of a mathematical graph: a collection of objects (“nodes”) with explicit connections between them (“edges”). Graphs are all around us, from family trees to social networks. In a scriptural context, consider the cross-reference from Luke 6:13 to 1 Ne. 12:7. These verses are nodes in a graph connected by an edge between them:
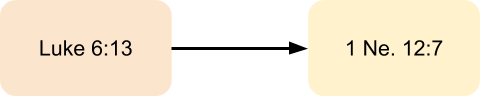
This is a directed graph, meaning that the edges have a direction associated with them (Luke 6:13 “points to” 1 Ne. 12:7, but 1 Ne. 12:7 does not necessarily point back). In practice, more than 80% of cross-references are reciprocal—there are edges pointing in both directions.
Reference Counts
Modulo any bugs in my verse and reference parsing code, there are 41,995 verses and 45,985 cross-references between verses in the standard works ( excluding references from study helps like the Topical Guide). Perhaps unsurprisingly, more than 50% of verses in the standard works are not referenced by any other verse (although they may be included in study helps like the Topical Guide) . The next largest batch of verses (~40%) have between one and five references. The plot below shows the CDF for references to all verses.

The verses with the most references in each of the standard works are listed in the table below. Note that the reference counts are for “incoming” edges (the number of verses that reference this verse) rather than “outgoing” edges (the number of verses that this verse references).
| Verse | References |
|---|---|
| Mal. 4:1 | 20 |
| Rom. 1:16 | 13 |
| 1 Ne. 17:35 | 25 |
| Hel. 12:3 | 25 |
| D&C 1:38 | 27 |
| D&C 17:1 | 27 |
| Moses 6:57 | 23 |
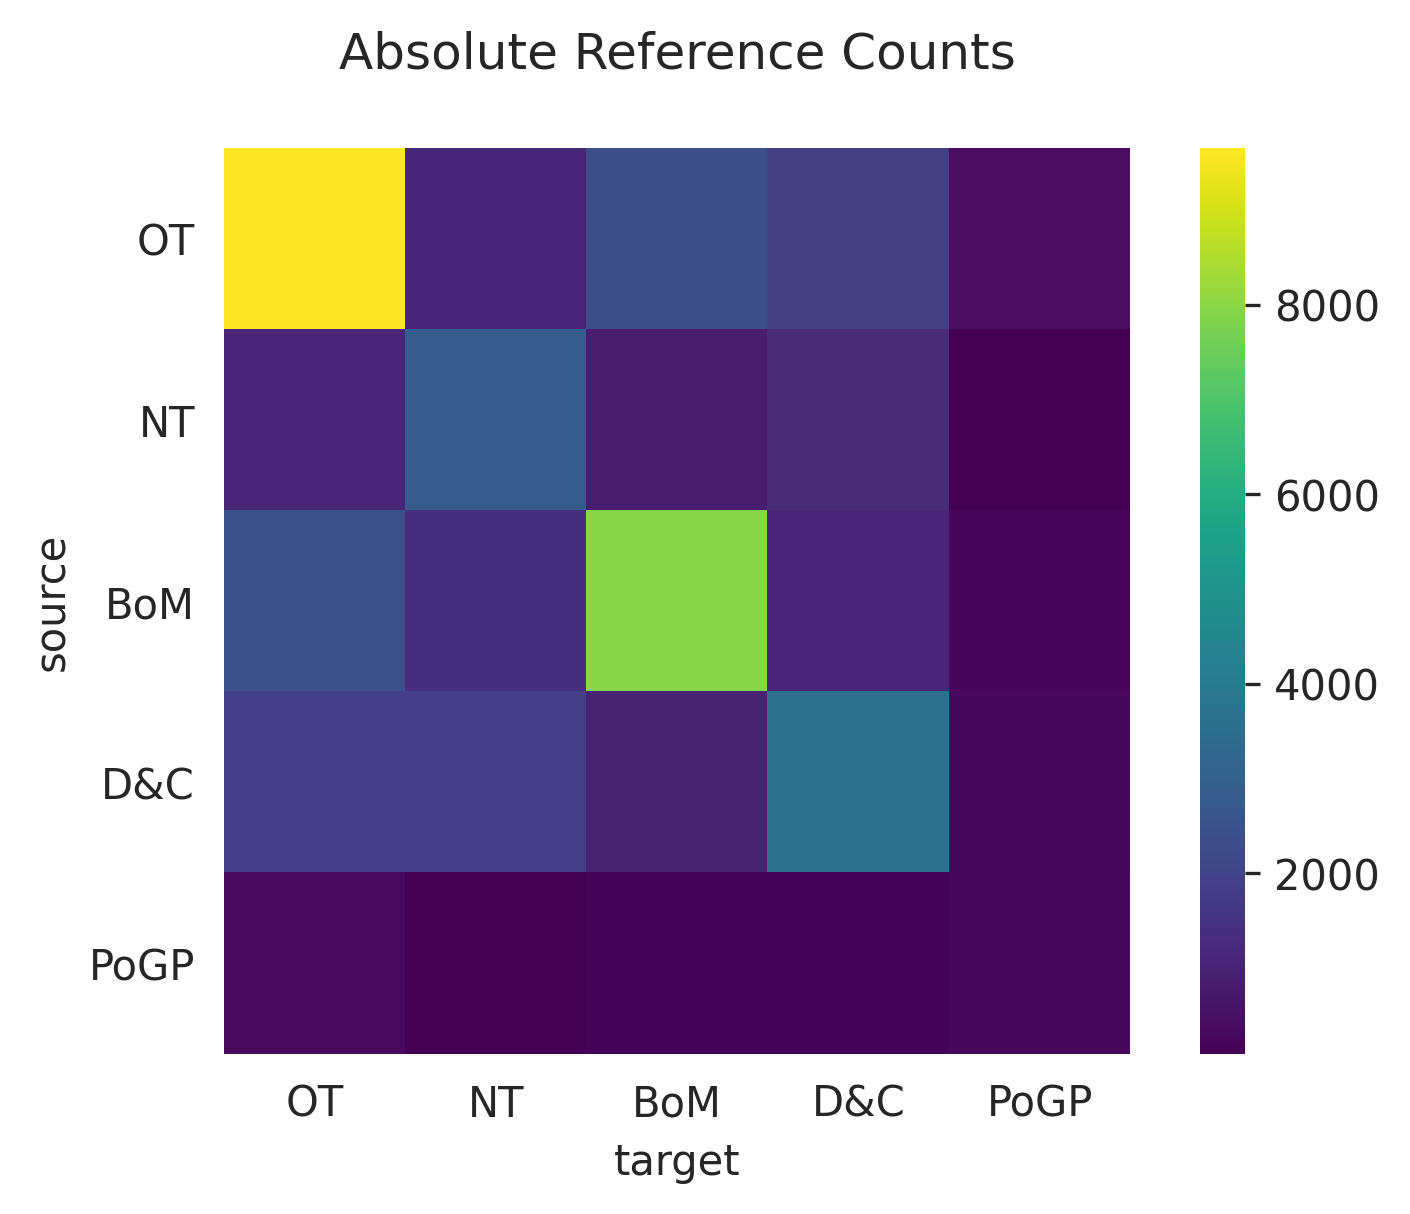
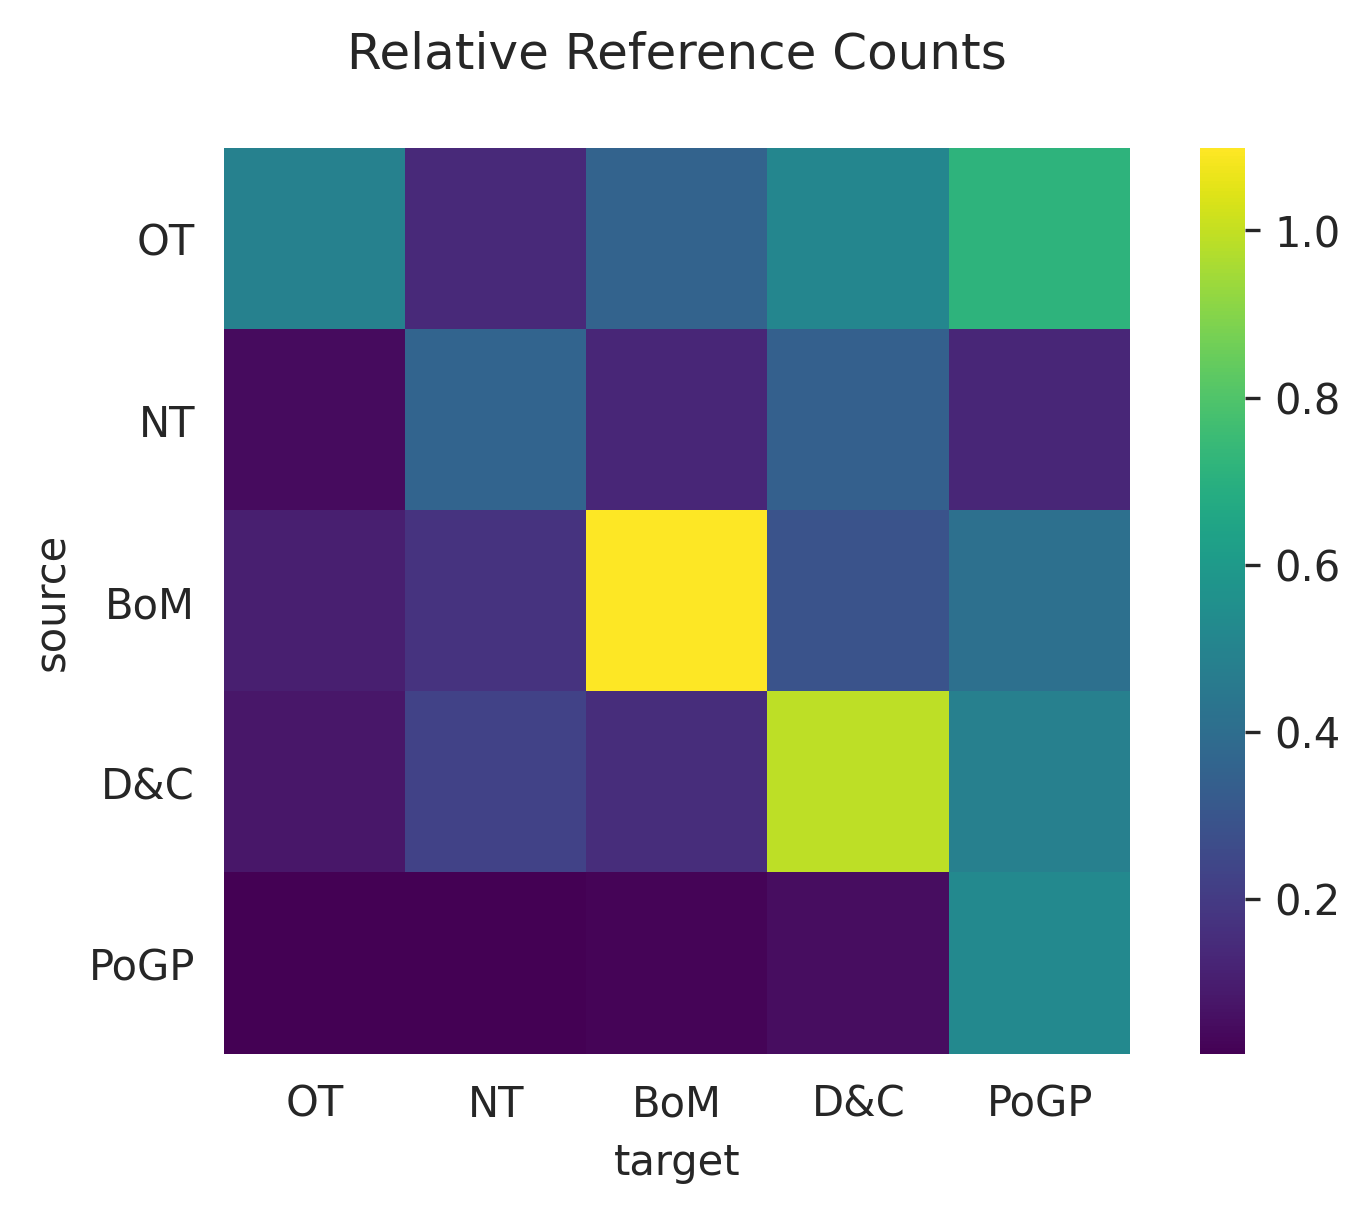
The figure below shows the number of references to each of the standard works. The “relative” reference count is also computed; this is the number of references to a volume divided by the number of verses in that volume. A relative count of 1.0 means that, on average, every verse in the volume is referenced once. Notably, the Pearl of Great Price has the fewest references among all the standard works (1435), but the highest number of references per verse (2.3).

Reference Patterns
Now we turn to the relationships between the standard works and their books. If we consider all pairs of standard works, we can construct a heatmap that shows the reference counts from one volume to another. The diagonal (top left to bottom right) reports the number of references from that volume to itself (e.g. Luke 1:24 → Luke 2:5). The off-diagonal entries are read as (row, column) pair; for example, the third entry in the first row shows the number of references from the Old Testament to the Book of Mormon.
As before, we can also compute “relative” reference counts: the number of references divided by the number of verses. Now we see that, on average, each verse in the Book of Mormon is referenced 1.2 times by other verses in the Book of Mormon and 0.03 times by verses in the Pearl of Great Price.
We can also construct absolute and relative heat maps for all the books in the standard works (note that the Doctrine and Covenants is treated as a single book here). You can click on the images below to zoom in.
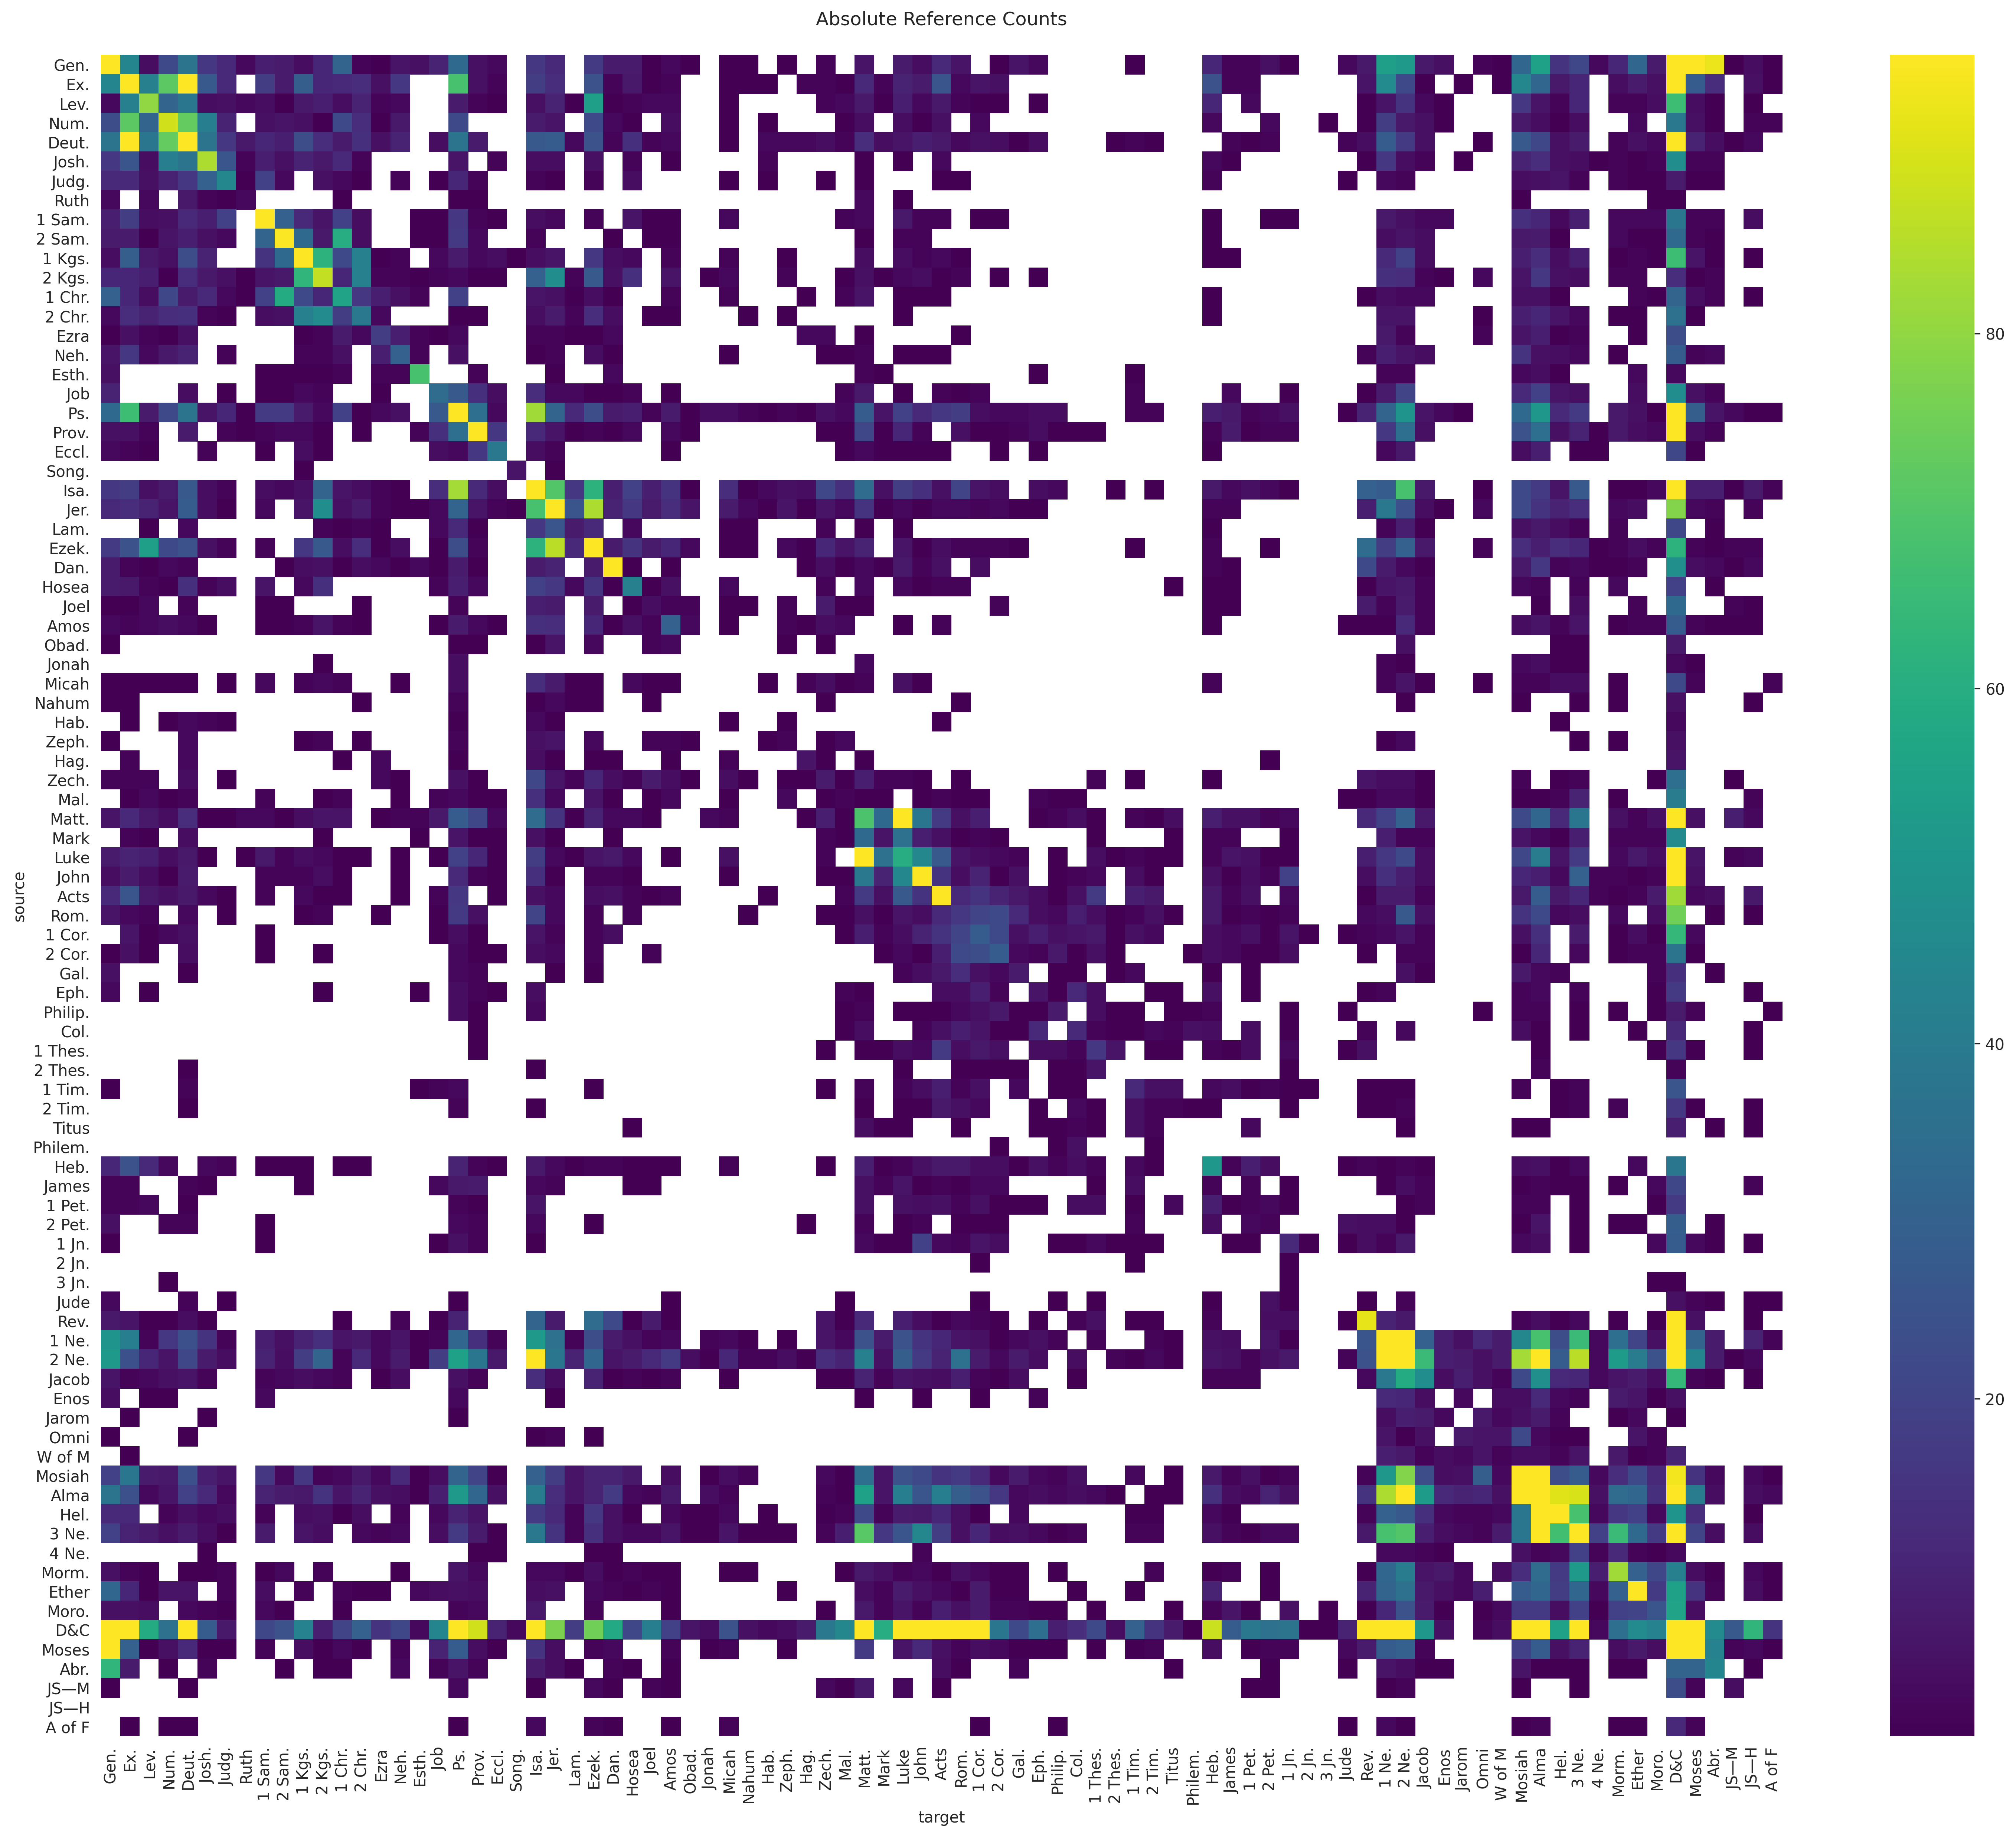

We can see some interesting patterns here. For instance, Mosiah and Alma tend to reference each other, and 1 Thes. is cited heavily by Acts. Digging deeper into these heat maps is a good topic for future posts.
The Cross-Reference Graph
Earlier, I showed a simple graph with two nodes and a single edge. We can scale up and build a graph containing all verses and cross-references in the standard works. If you thought the heat maps above were complicated, take a look at this:
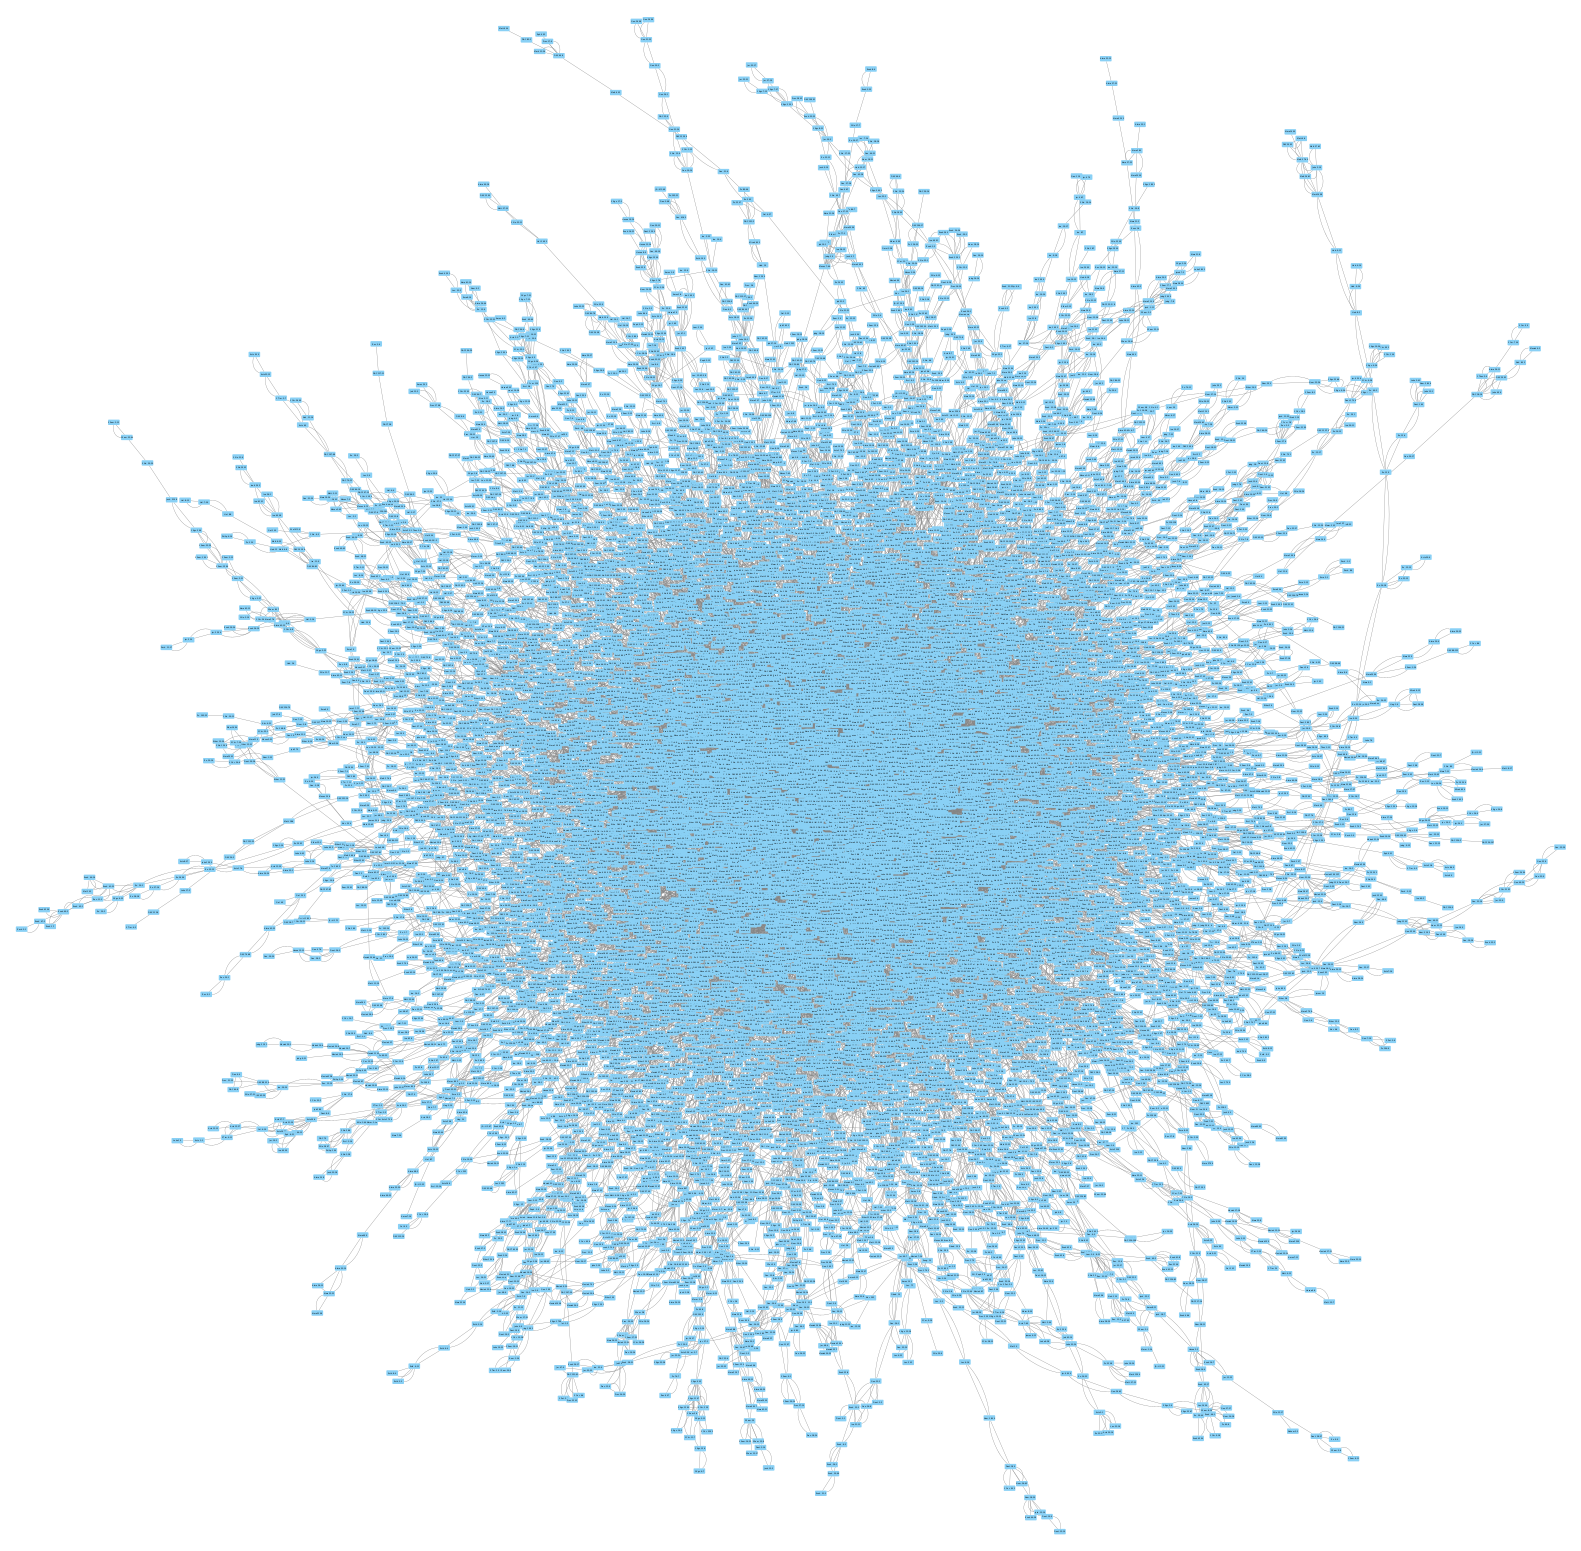
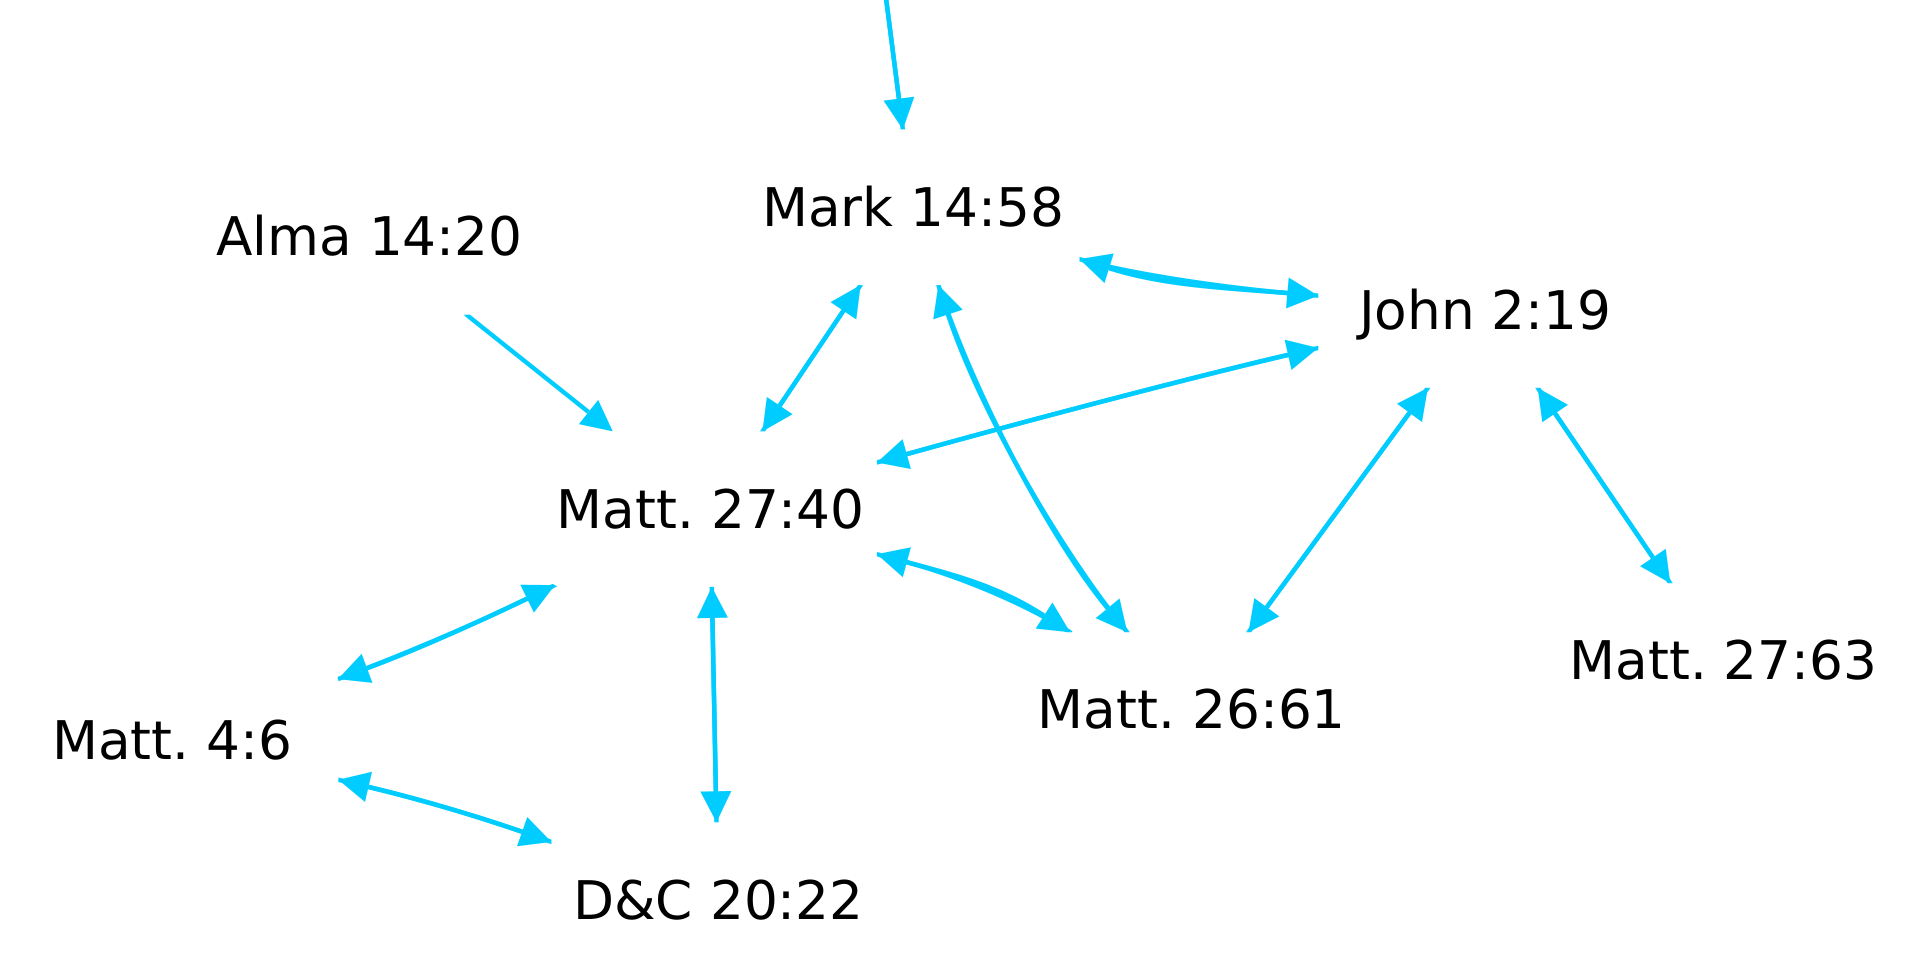
This is a bit overwhelming, but we can zoom in on one of the appendages to get a better idea of the structure. The group of nodes below contains verses referring to the temptation of Christ.
There are a number of interesting algorithms that can be applied to this graph to dive deeper into its underlying structure. This includes identifying hubs and running algorithms like PageRank (used in Google search to assign importance to web pages). Additionally, there are machine learning opportunities such as node embedding and link prediction that can be used to propose new connections. Study helps like the Topical Guide will eventually be added to the graph as well. As with the heatmaps above, deeper exploration of this graph will be the subject of future posts.
Closing Thoughts
As you can see, we are just scratching the surface of the data presented here—we haven’t even considered the text yet! Much work remains to incorporate additional references from study helps like the Topical Guide and the Index to the Triple Combination.
This work is complementary to the excellent LDS Scripture Citation Index; that project focuses on references to scripture by modern prophets and other church leaders, while this project emphasizes relationships within and between scriptures.
Using existing annotations as a starting point has pros and cons. For instance, the existing annotations are numerous and inspired. However, they are also incomplete; the topics in the Topical Guide, for instance, were selected from a much larger list, and undoubtedly similar filtering was applied to the cross-references between verses. This creates the possibility of supplementing the existing references with additional annotations that can help to expand our understanding of the scriptures and reveal new insights into their meaning. This expansion and revelation are the ultimate goals of this project.
The code used for the analysis and figures in this post is available on GitHub. Additional images were generated with Google Drawings and Cytoscape.
Updates:
- December 30, 2020: Fixed a bug when parsing JST references that caused a number of self-edges to be formed. This changed the edge count in the cross-reference graph from 45,880 to 45,786. This also resulted in many more ties in reference counts for the New Testament, so the table of the most cited verses was updated to show only the top-ranked verses rather than two from each volume.
- January 4, 2021: Updated the reference parsing code to handle multiple verses in the same chapter (e.g. “1 Ne. 3:7, 10” now creates edges to 1 Ne. 3:7 and 1 Ne. 3:10). This changed the edge count from 45,786 to 45,985.

© Copyright 2020–2022 Steven Kearnes. This work is licensed under a Creative Commons Attribution-ShareAlike 4.0 International License.